Amazon profit tracking is the fastest way to understand whether your business is truly healthy. Revenue shows demand, but net profit shows sustainability. To protect margins, sellers should calculate all costs, track SKU level performance, compare category fee benchmarks, and review profit every week with SellerSprite Profitability Calculator.
Key Takeaways
- Revenue can look impressive while profit stays weak, so Amazon sellers should track net profit before scaling.
- SellerSprite Profitability Calculator helps sellers estimate net profit, profit margin, total revenue, and total cost.
- A profitable SKU and a losing SKU can look similar in revenue until you add referral fees, FBA fees, ads, returns, and storage.
- Amazon referral fees vary by category, so sellers should verify current fees before setting prices or placing large orders.
- A weekly margin checklist keeps pricing, ads, inventory, and product decisions grounded in real numbers.
Table of Contents
- Why does Amazon profit matter more than revenue?
- What costs should Amazon sellers include in margin tracking?
- How do Amazon fees and category margins affect profit?
- What do real SKU profit examples look like?
- How do you use SellerSprite Profitability Calculator step by step?
- What should sellers check every week?
- FAQ
- References
Note on marketplaces: Examples in this article focus on Amazon.com. Always verify current Amazon fees, taxes, storage charges, and marketplace rules before making pricing or sourcing decisions.
Why does Amazon profit matter more than revenue?
Revenue is the number most sellers notice first. It is visible, exciting, and easy to compare. But profit is the number that pays for your next purchase order, protects your cash flow, and keeps your Amazon business alive through fee changes, ad competition, and seasonal demand swings.
A product can generate high sales and still lose money if the unit cost is too high, the package is too expensive to fulfill, the coupon is too aggressive, or PPC spend rises above the break even point. This is why profit tracking should not be a monthly afterthought. It should be part of your weekly operating rhythm.
SellerSprite is built to help sellers turn market signals into measurable profit. The platform has supported Amazon sellers for more than 8 years and now serves a global seller base with 1.7M+ registered sellers and 700K+ browser extension installs. That scale gives the SellerSprite team a broad view of the common mistakes sellers make when they chase revenue without protecting margins.
What costs should Amazon sellers include in margin tracking?
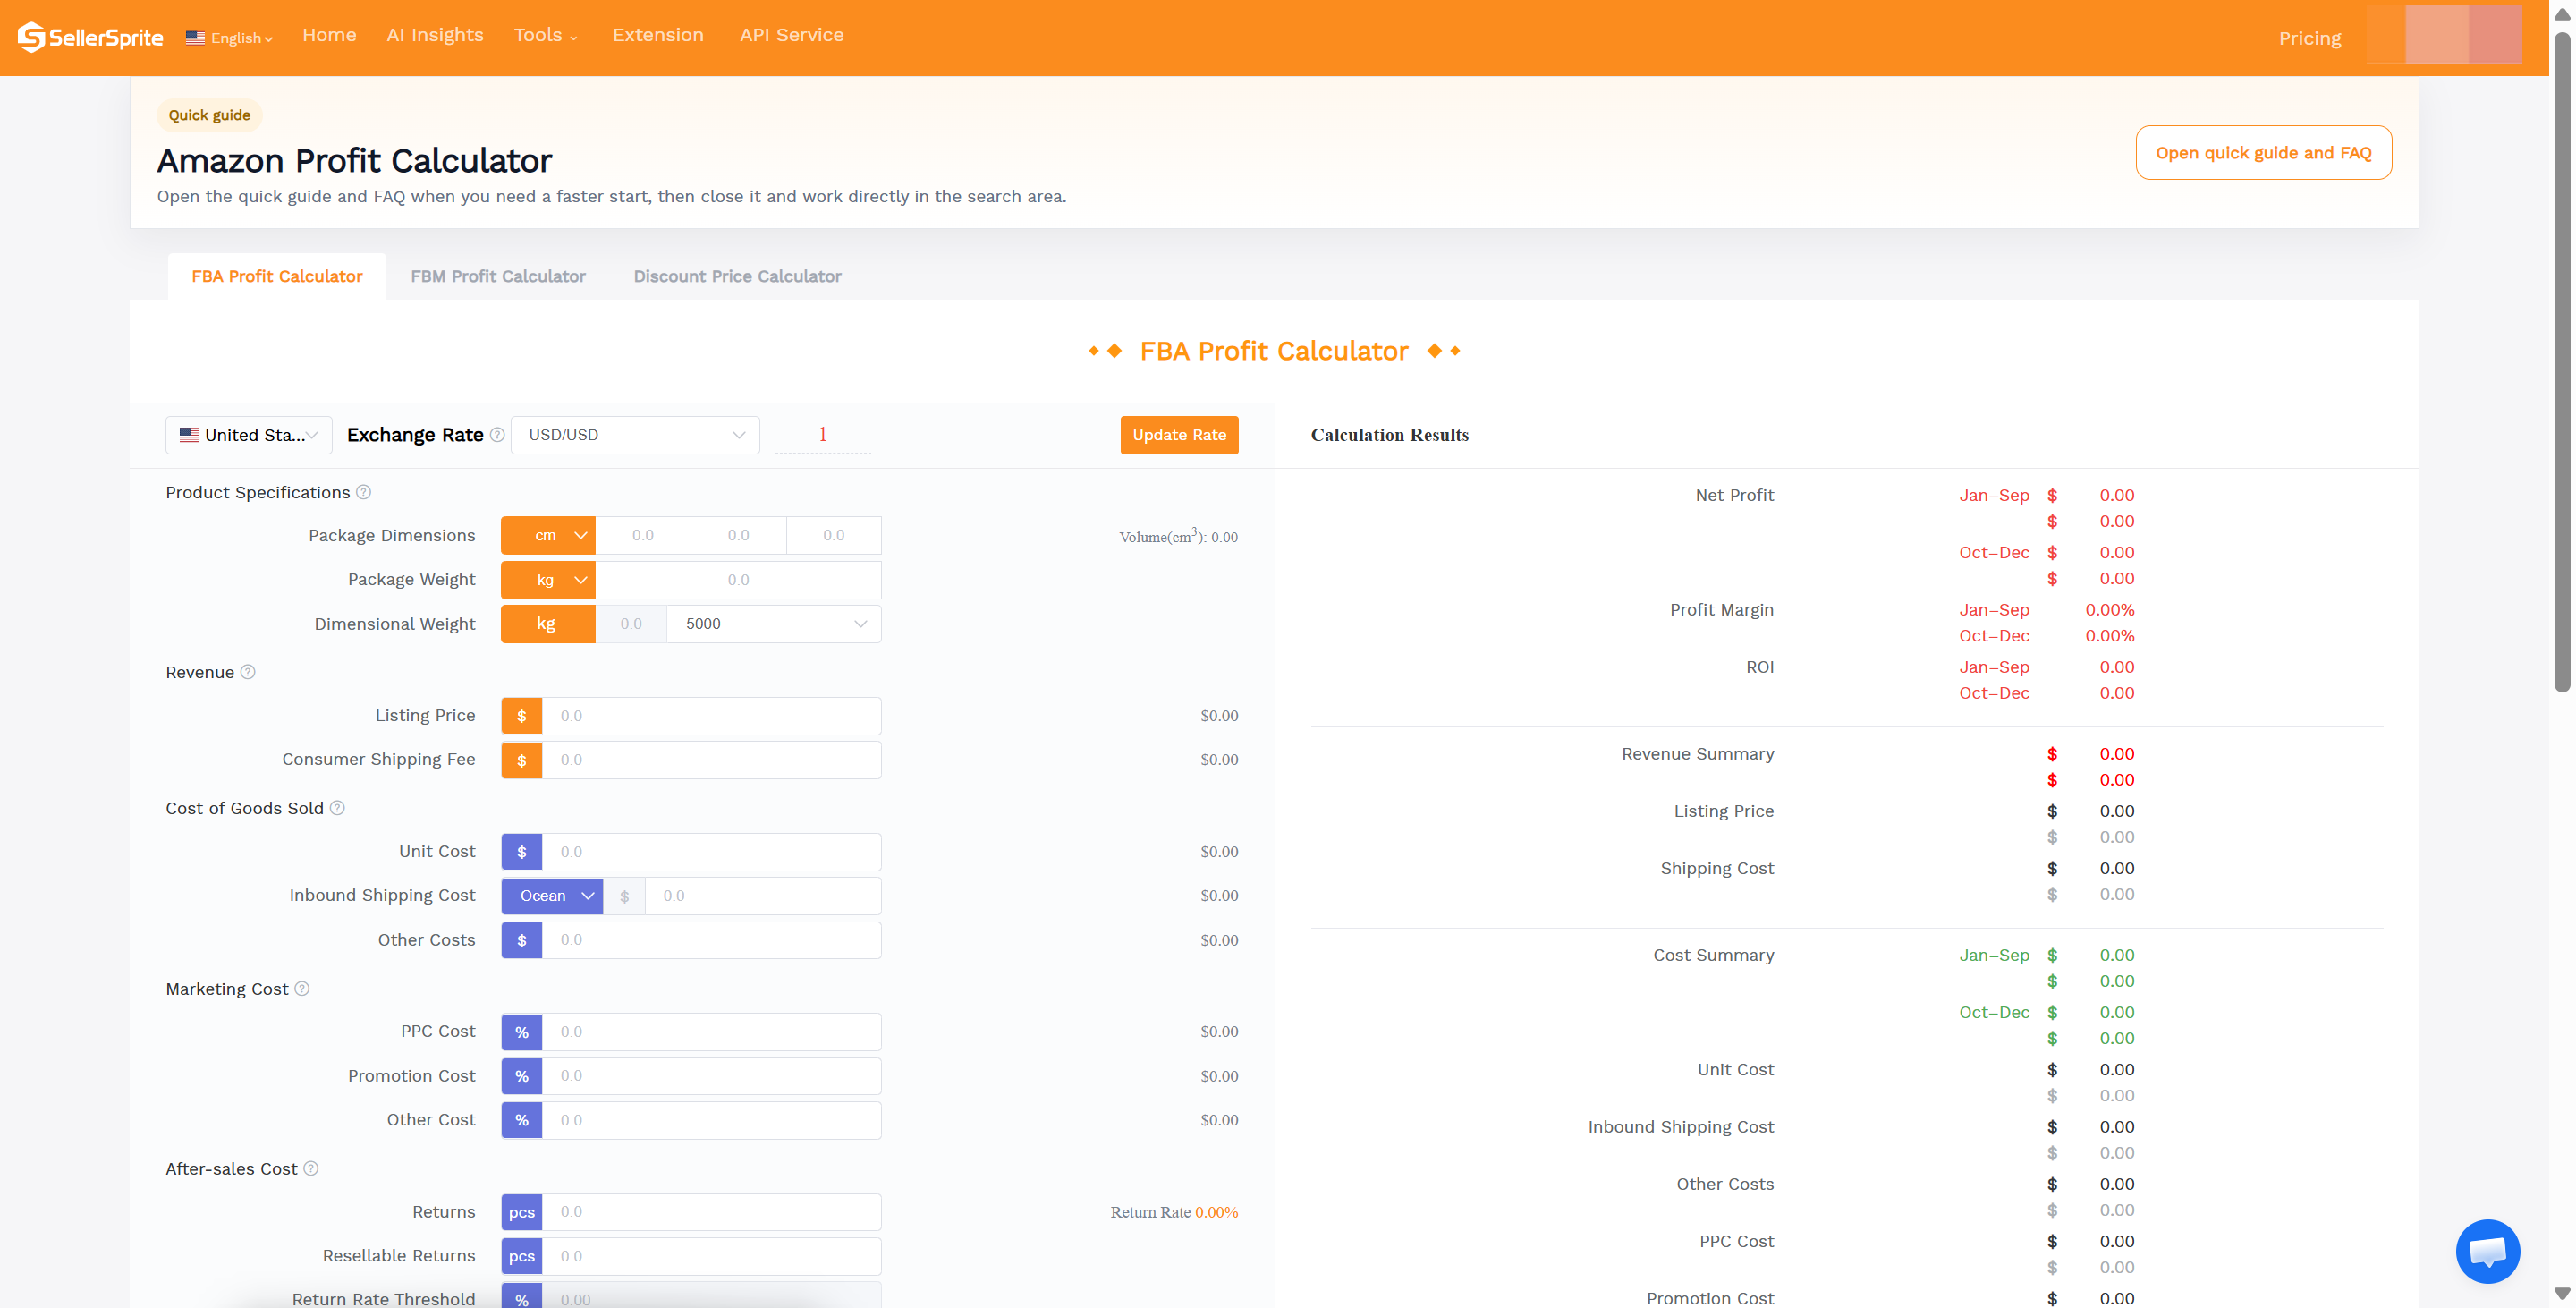
True Amazon profit is more than selling price minus product cost. You need to include every cost that reduces the cash you keep after a sale. SellerSprite Profitability Calculator is useful because it organizes the calculation into revenue, cost of goods, marketing cost, after sales cost, Amazon fees, and final results.
| Cost item | What it means | Why it matters |
|---|---|---|
| Unit cost | Factory or supplier cost per unit | The biggest controllable cost for many private label products |
| Inbound shipping | Freight, customs, and delivery to Amazon or warehouse | Can change sharply by weight, volume, season, and route |
| Referral fee | Amazon category based commission on each sale | A category difference of a few points can change product viability |
| FBA fee | Fulfillment fee based on size, weight, and program rules | Oversized or heavy products often need higher prices to stay profitable |
| PPC cost | Advertising spend allocated to each sale | A product can be profitable before ads and unprofitable after ads |
| Promotions | Coupons, discounts, deals, or launch incentives | Promotions can drive velocity but compress contribution margin |
| Returns | Refunds, damaged units, return processing, and after sales costs | High return rates can quietly erase a healthy looking margin |
| Storage | Inventory holding cost in Amazon fulfillment centers | Slow moving products become less profitable every month they sit |
The goal is not to make the calculation complicated. The goal is to make it complete. Once you can see every major cost, you can decide whether to raise price, renegotiate with suppliers, reduce packaging weight, adjust ad spend, or retire a weak SKU.
How do Amazon fees and category margins affect profit?
Amazon referral fees are category based. Amazon states that sellers pay either a percentage of the total price or a minimum amount, whichever is greater. Some categories are simple, while others use price tiers. This means sellers should not assume every product has the same fee rate.
| Category example | Common Amazon referral fee logic | Margin note |
|---|---|---|
| Computers | Often around 8 percent | Lower referral fee can help, but competition and price pressure may be high |
| Consumer Electronics | Often around 8 percent | Margin depends heavily on return rate, warranty risk, and price competition |
| Home and Kitchen | Often around 15 percent | Common private label category where packaging size and reviews matter |
| Beauty, Health, and Personal Care | Often tiered by price | Good margins are possible, but compliance and returns must be watched |
| Clothing and Accessories | Often tiered by price and can reach 17 percent for higher priced items | Return rate and size issues can create hidden margin loss |
| Amazon Device Accessories | Can be much higher than most categories | Always verify the exact fee before sourcing |
Industry benchmarks vary by business model and category. As a practical planning range, many Amazon sellers view 15 to 20 percent net margin as a reasonable baseline, while 25 percent or higher is often considered strong for private label products. If your modeled margin is below 10 percent, there may be too little room for ads, returns, and fee changes unless you have a very clear strategic reason.
| Margin range | How to read it | Suggested action |
|---|---|---|
| Below 8 percent | High risk | Recheck price, cost, package size, and ad budget before scaling |
| 8 to 15 percent | Thin but workable in some models | Monitor weekly and protect cash flow carefully |
| 15 to 25 percent | Healthy for many sellers | Optimize ads and inventory while protecting margin |
| 25 to 35 percent | Strong | Consider reinvesting into content, ads, and product improvement |
| Above 35 percent | Excellent, but verify sustainability | Check whether competitors can copy price or sourcing advantage |
What do real SKU profit examples look like?
The following examples are simplified models to show how two SKUs with similar revenue can produce very different business outcomes. Use SellerSprite Profitability Calculator with your own dimensions, category, supplier quote, ad data, and return assumptions before making real sourcing decisions.
Case 1. SKU A looks attractive but loses money after ads
| Line item | Amount per unit |
|---|---|
| Selling price | $24.99 |
| Unit cost | $7.80 |
| Inbound shipping | $2.40 |
| Referral fee at 15 percent | $3.75 |
| Estimated FBA fee | $5.70 |
| PPC cost at 22 percent of sales | $5.50 |
| Returns and after sales cost | $1.25 |
| Total cost | $26.40 |
| Net profit | -$1.41 |
| Profit margin | -5.6 percent |
What this means: SKU A may still generate orders, but every unit sold creates a loss under these assumptions. The seller should not scale this SKU until they reduce ad spend, increase price, lower landed cost, reduce package fees, or improve conversion.
Case 2. SKU B has lower drama and stronger profit
| Line item | Amount per unit |
|---|---|
| Selling price | $34.99 |
| Unit cost | $8.60 |
| Inbound shipping | $2.10 |
| Referral fee at 15 percent | $5.25 |
| Estimated FBA fee | $4.95 |
| PPC cost at 12 percent of sales | $4.20 |
| Returns and after sales cost | $0.80 |
| Total cost | $25.90 |
| Net profit | $9.09 |
| Profit margin | 26.0 percent |
What this means: SKU B has a stronger price to cost structure, lower fulfillment burden, and more manageable ad pressure. It gives the seller room to reinvest, test coupons, or absorb temporary fee and shipping changes.
How do you use SellerSprite Profitability Calculator step by step?
SellerSprite Profitability Calculator helps sellers model profit before sourcing, before changing price, and before scaling ads. You can use the web calculator for detailed planning or the SellerSprite browser extension to calculate profit directly while browsing Amazon product pages.
Step 1. Select the marketplace and fulfillment mode
Choose your target marketplace, such as United States, then select FBA or FBM. FBA should include Amazon fulfillment fees, while FBM should include your own shipping and handling costs.
Step 2. Enter product specifications
Input package dimensions and package weight. This matters because fulfillment cost often changes when the product moves into a different size or weight tier.
Step 3. Add revenue assumptions
Enter listing price and any consumer shipping fee. For most FBA offers, the consumer shipping field may be zero, but always model the actual checkout experience for your product.
Step 4. Add cost of goods and logistics
Enter unit cost, inbound shipping cost, and other costs. Other costs can include packaging upgrades, inspection, prep, 3PL handling, design, inserts, or any per unit cost that affects profit.
Step 5. Add marketing and promotion assumptions
Add estimated PPC cost, promotional cost, and any other selling cost. For launch planning, create at least three scenarios: conservative ads, expected ads, and aggressive ads.
Step 6. Add after sales assumptions
Enter expected return rate and returns processing cost if relevant. If your category has high return risk, such as apparel, electronics, or fragile goods, model a higher return rate before you commit to inventory.
Step 7. Review net profit and profit margin
SellerSprite will calculate net profit, profit margin, total revenue, and total cost. Do not only look at the final profit number. Review which cost line is creating the most pressure. That is where your next action should begin.
Start Tracking Your Real Profit Today
Use SellerSprite Profitability Calculator to uncover hidden costs, compare scenarios, and protect your Amazon margins.
What should sellers check every week?
Profit tracking works best when it becomes a habit. You do not need a complicated finance meeting every week. You need a simple checklist that tells you where margin is improving and where it is leaking.
- Review your top 10 SKUs by net profit, not just by revenue.
- Check whether any SKU has crossed below your minimum margin threshold.
- Update unit cost, inbound shipping, packaging, and other cost assumptions if supplier quotes changed.
- Compare PPC cost against your break even ACoS and actual margin.
- Review coupon and promotion impact before extending discounts.
- Check returns, negative reviews, and product complaints for signs of quality or expectation mismatch.
- Use Product and Keyword Tracker to monitor price, sales, ratings, BSR, and competitor movement.
- Record major changes such as price tests, new images, coupons, packaging updates, or ad budget changes.
A weekly review keeps you close to the business. It also helps you act before a small cost problem becomes a cash flow problem.
How does SellerSprite help you connect profit with performance?
Profit is not separate from operations. It is connected to product research, keyword demand, price position, review quality, ad efficiency, and inventory planning. SellerSprite helps sellers connect these signals instead of reviewing them in isolation.
Use Profitability Calculator to model margin, Product and Keyword Tracker to monitor daily movement, Review Analysis to identify product problems that can hurt conversion, and the SellerSprite extension to evaluate competitors directly on Amazon pages. Together, these tools help you make faster decisions with clearer financial context.
Get Help From the SellerSprite Community
Share your negotiation situation, get feedback, and learn from other sellers in the SellerSprite Discord and Facebook Group.
View The SellerSprite Course Directory
Ready for the next step? Open the SellerSprite Academy course directory to continue building your Amazon FBA skills chapter by chapter.
FAQ
What is a good profit margin for Amazon sellers?
A good margin depends on your category and business model. As a practical benchmark, 15 to 20 percent net margin is often a reasonable baseline, while 25 percent or higher is strong for many private label products. Always compare against your own fee structure, return rate, and ad spend.
How often should I check Amazon profit by SKU?
Check profit weekly as a baseline. During launch periods, high ad spend periods, Prime Day preparation, Q4, or major price tests, review key SKUs more often because small changes can affect margin quickly.
Why can a high revenue product lose money?
A high revenue product can lose money when product cost, referral fees, FBA fees, coupons, PPC, returns, storage, and logistics exceed the selling price. This is why sellers should calculate true net profit rather than only tracking sales.
How can SellerSprite Profitability Calculator help before sourcing?
Before sourcing, enter the expected selling price, unit cost, inbound shipping, Amazon fees, PPC cost, promotion cost, return assumptions, and units sold. If the modeled margin is too thin, you can adjust the product, price, package, or supplier terms before committing cash.
Author and data background
By SellerSprite Academy Team
The SellerSprite Academy Team creates practical Amazon seller workflows based on SellerSprite product experience, marketplace analytics, and feedback from a global user community. SellerSprite has supported Amazon sellers for more than 8 years, with 1.7M+ registered sellers worldwide and 700K+ browser extension installs. Our goal is to help sellers move from guesswork to clearer decisions across product research, keyword discovery, profit modeling, and performance tracking.
Editorial note: Profit examples in this article are educational models. Actual Amazon fees, advertising costs, storage fees, taxes, return rates, and supplier costs vary by product and marketplace. Always verify your own numbers before sourcing or scaling.
References
- Amazon selling fees and referral fee schedule: Amazon Pricing
- SellerSprite Profitability Calculator: Open Calculator
- SellerSprite Profit Calculator extension guide: View Guide
- SellerSprite Product and Keyword Tracker guide: View Guide
- SellerSprite platform and data scale: SellerSprite Homepage
- Amazon FBA profit margin benchmark reference: View Benchmark