TL;DR: Amazon sellers should not judge market conditions from price, inventory, BSR, sales, or keyword rankings in isolation. The most useful Amazon Stock and Seller Insights come from reading these signals together. Start with historical demand and price patterns, check inventory and competitor movement, validate keyword visibility and customer response, then confirm that the opportunity still works after realistic margin and inventory assumptions.
Key Takeaways
- ✓ Amazon Stock and Seller Insights works best as a multi-signal marketplace framework combining price, inventory, BSR, estimated sales, keywords, reviews, competition, and margin.
- ✓ A single movement rarely explains the market. A price cut, stockout, or BSR change becomes more meaningful when several independent signals move in the same direction.
- ✓ Historical context matters more than a one-day snapshot. Compare current activity with prior weeks, seasonal periods, and representative competitors before taking action.
- ✓ SellerSprite can help connect product, competitor, keyword, and historical data so sellers can move from market observation to clearer sourcing, pricing, inventory, and optimization decisions.
Table of Contents
- Quick Answer
- What Does Amazon Stock and Seller Insights Mean?
- Why Sellers Should Read Signals Together
- The 7 Market Signals Worth Watching
- How to Turn Market Signals Into Decisions
- Which Metrics Matter for Which Seller Decision?
- Example: What a Competitor Price Drop Really Tells You
- How SellerSprite Can Help Connect the Signals
- Common Mistakes When Reading Amazon Seller Signals
- A Simple Weekly Market Review
- The Bottom Line
- FAQ
- References
Marketplace note: This guide focuses on the Amazon US marketplace. Pricing, demand, fees, inventory conditions, category behavior, and competitive dynamics can differ across Amazon marketplaces.
Quick Answer
Amazon Stock and Seller Insights is not one Amazon metric. For sellers, it is a way to combine inventory availability, historical price, Best Sellers Rank, estimated sales, keyword visibility, reviews, seasonality, competitor movement, and product economics to understand what is changing in a market.
The most practical workflow is to start with the seller decision you need to make, establish a historical baseline, identify the market signal that changed, and then look for confirmation in other metrics before adjusting inventory, pricing, advertising, or product strategy.
The practical rule: One signal is an observation. Several aligned signals provide stronger evidence. Always validate the economics before turning market movement into action.
What Does Amazon Stock and Seller Insights Mean?
The phrase can be confusing because Amazon stock has two very different meanings.
In financial markets, Amazon stock refers to shares of Amazon.com, Inc. In an Amazon seller context, however, stock generally means product inventory: whether an ASIN is available, running low, repeatedly going out of stock, being replenished, or accumulating inventory faster than it sells.
This guide focuses exclusively on Amazon marketplace activity, not investment analysis of Amazon.com, Inc.
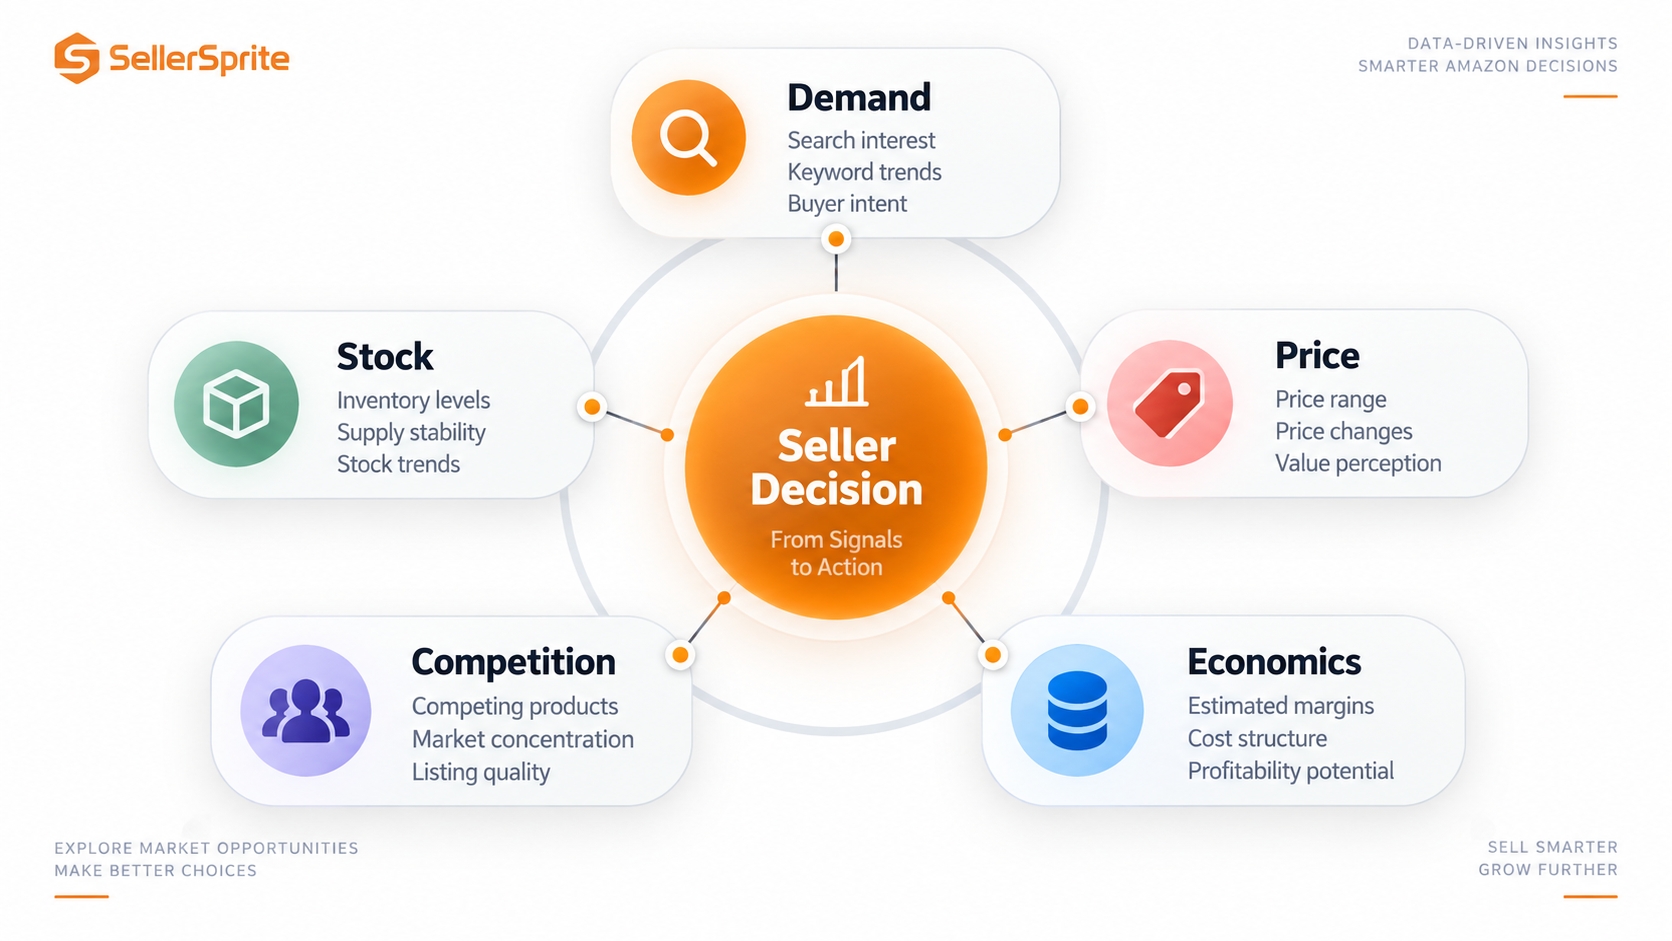
A useful seller-level view normally combines five groups of signals:
- Demand signals: estimated sales, BSR, search demand, and keyword visibility.
- Stock signals: availability, stockouts, replenishment behavior, and inventory pressure.
- Price signals: historical price changes, coupons, promotions, and persistent discounting.
- Competitive signals: review growth, new entrants, keyword gains, listing changes, and market concentration.
- Economics signals: margin, Amazon fees, advertising pressure, sourcing costs, and inventory risk.
Why Sellers Should Read Signals Together
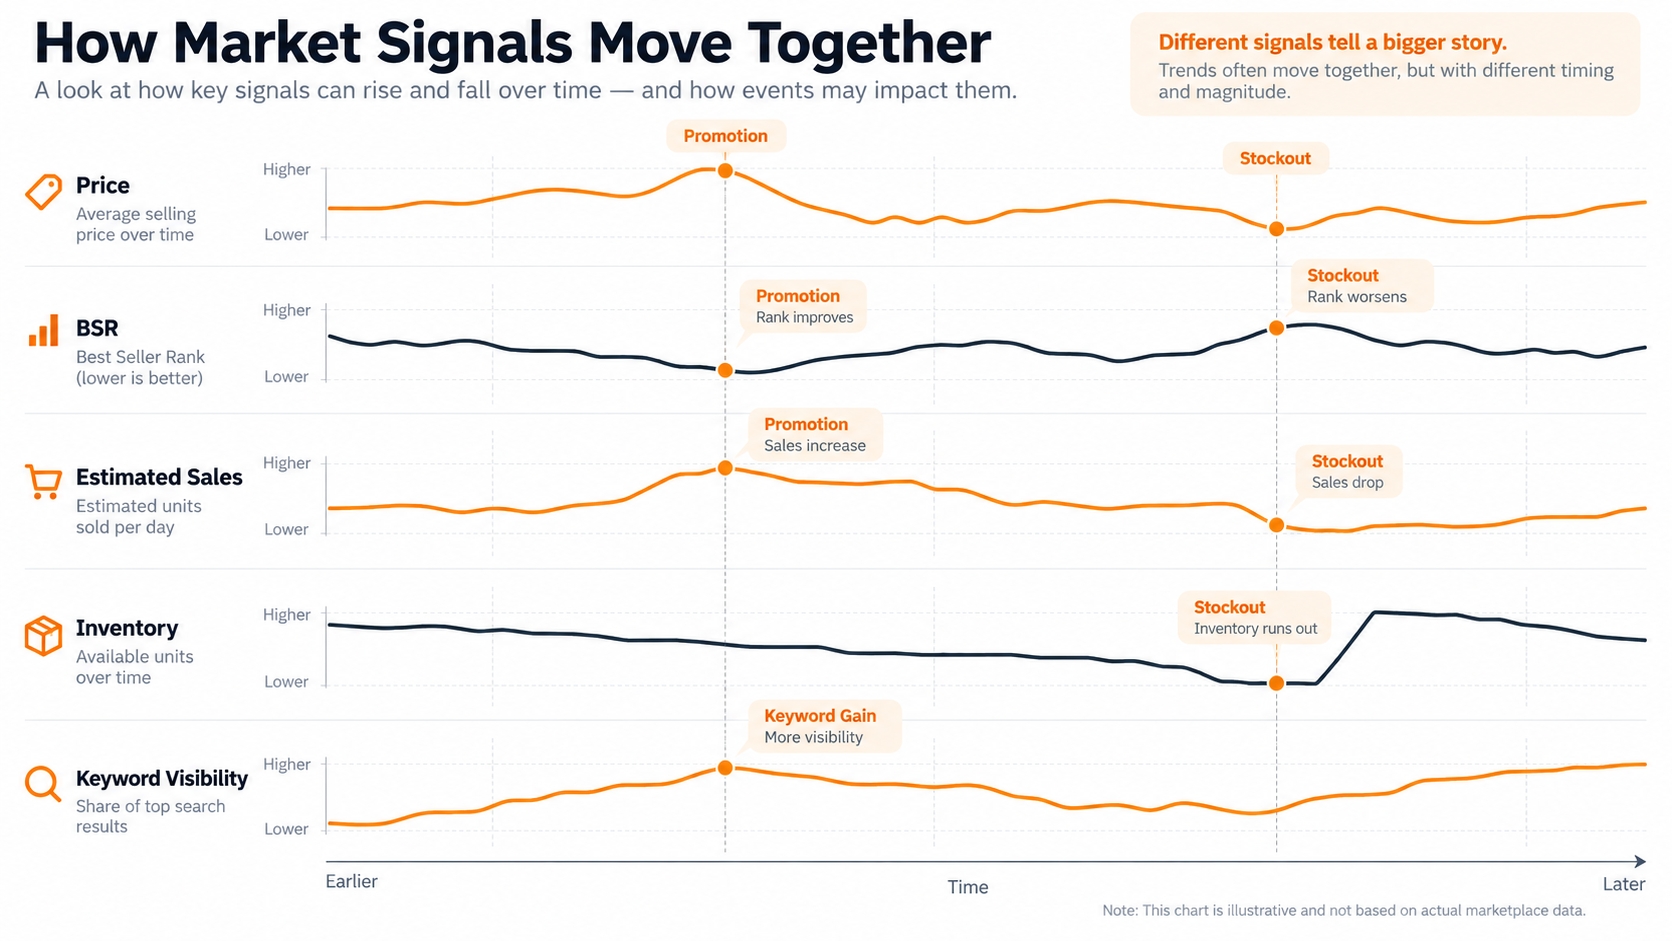
Marketplace metrics are contextual. The same movement can mean very different things depending on what happens around it.
Suppose a competitor cuts its price by 15%. That does not automatically mean you should match the discount. The competitor could be clearing excess inventory, running a temporary promotion, reacting to weaker conversion, or deliberately accepting lower margins to defend sales volume.
The better question is: what else changed at the same time?
- Did estimated sales increase?
- Did BSR improve?
- Did the listing gain important keyword positions?
- Was a coupon or promotion added?
- Did other competitors also change price?
- Is the category entering a seasonal demand period?
If price falls while sales, BSR, and keyword visibility remain largely unchanged, the discount may be producing limited incremental demand. If sales strengthen while several competing listings lose stock and search visibility shifts, the same price move may be part of a more meaningful market change.
Historical context helps separate those situations. For a deeper look at this process, see SellerSprite's guide to tracking Amazon price history .
The 7 Market Signals Worth Watching
No single Amazon metric can explain what is happening in a market. Sellers get a clearer picture when they compare several signals that reflect demand, competition, inventory conditions, search visibility, and product economics.
The following seven signals are especially useful for identifying meaningful market changes and deciding whether a shift deserves further investigation or action.
1. Price History
Current price tells you what a product costs now. Price history tells you much more about how a seller competes.
Look for patterns such as:
- repeated discount cycles;
- coupon-heavy selling periods;
- price increases after competitors stock out;
- persistent downward price pressure;
- stable pricing despite increasing competition.
These patterns help reveal whether a category competes primarily on price or whether sellers appear able to maintain differentiated price points.
2. Best Sellers Rank and Sales Trend
Amazon defines Best Sellers Rank, or BSR, as a product's sales rank relative to similar products within a category. Generally, a lower BSR represents a stronger relative sales rank.
BSR should not be treated as an exact unit-sales counter, and it is different from organic keyword ranking. A product can have a strong category sales rank without holding the top organic position for every major keyword.
When researching a market, compare BSR with estimated sales and historical patterns instead of treating one current rank as a standalone conclusion. Amazon's official Best Sellers Rank guide provides additional context on how Amazon describes the metric.
3. Inventory Availability and Stockouts
Inventory movement can reveal opportunities or risks that price and sales data alone may miss.
Repeated stockouts can coincide with strong demand, but they can also result from supply-chain problems, conservative purchasing, poor forecasting, or fulfillment constraints. Overstock can reflect slow sell-through, excessive purchasing, weaker demand, or preparation for an upcoming seasonal event.
Ask this instead: Is the competitor's inventory behavior changing in a way that also affects sales, rank, price, or keyword visibility?
4. Keyword Visibility
Sales movement becomes more informative when you know where marketplace visibility may be coming from.
Track signals such as:
- new organic keywords;
- keyword ranking gains and losses;
- high-intent long-tail terms;
- keyword overlap across major competitors;
- paid versus organic visibility where relevant data is available.
Keyword movement can help explain why product performance may be changing instead of simply showing that it changed.
5. Review Growth and Rating Movement
Reviews are not a direct measure of current sales, but review growth can add useful competitive context. Rapid review accumulation may accompany increasing sales activity, while declining ratings can expose customer dissatisfaction that is not obvious from price or keyword data.
Review content is especially useful because it explains what buyers value or dislike. If several leading products receive similar complaints, that pattern may indicate a potential product differentiation opportunity.
6. Competitive Entry and Concentration
Rising demand does not automatically make a market easier to enter.
Compare:
- the number of meaningful competitors;
- brand concentration;
- review concentration;
- share of keyword visibility;
- new-listing activity;
- price clustering.
If demand grows but new sellers enter even faster, customer acquisition may become more expensive. If a few established brands increasingly dominate first-page visibility, a new entrant may require stronger differentiation or a narrower market position.
7. Margin After Competitive Pressure
A product opportunity only matters if the economics still work after realistic competitive conditions are included.
Before matching a competitor's discount, estimate what happens to your margin after:
- Amazon referral fees;
- fulfillment and storage costs;
- advertising spend;
- coupon and promotional costs;
- product and shipping costs;
- returns and other relevant operating costs.
A category can look attractive on sales volume while offering little room for error once price pressure and customer acquisition costs are included.
How to Turn Market Signals Into Decisions
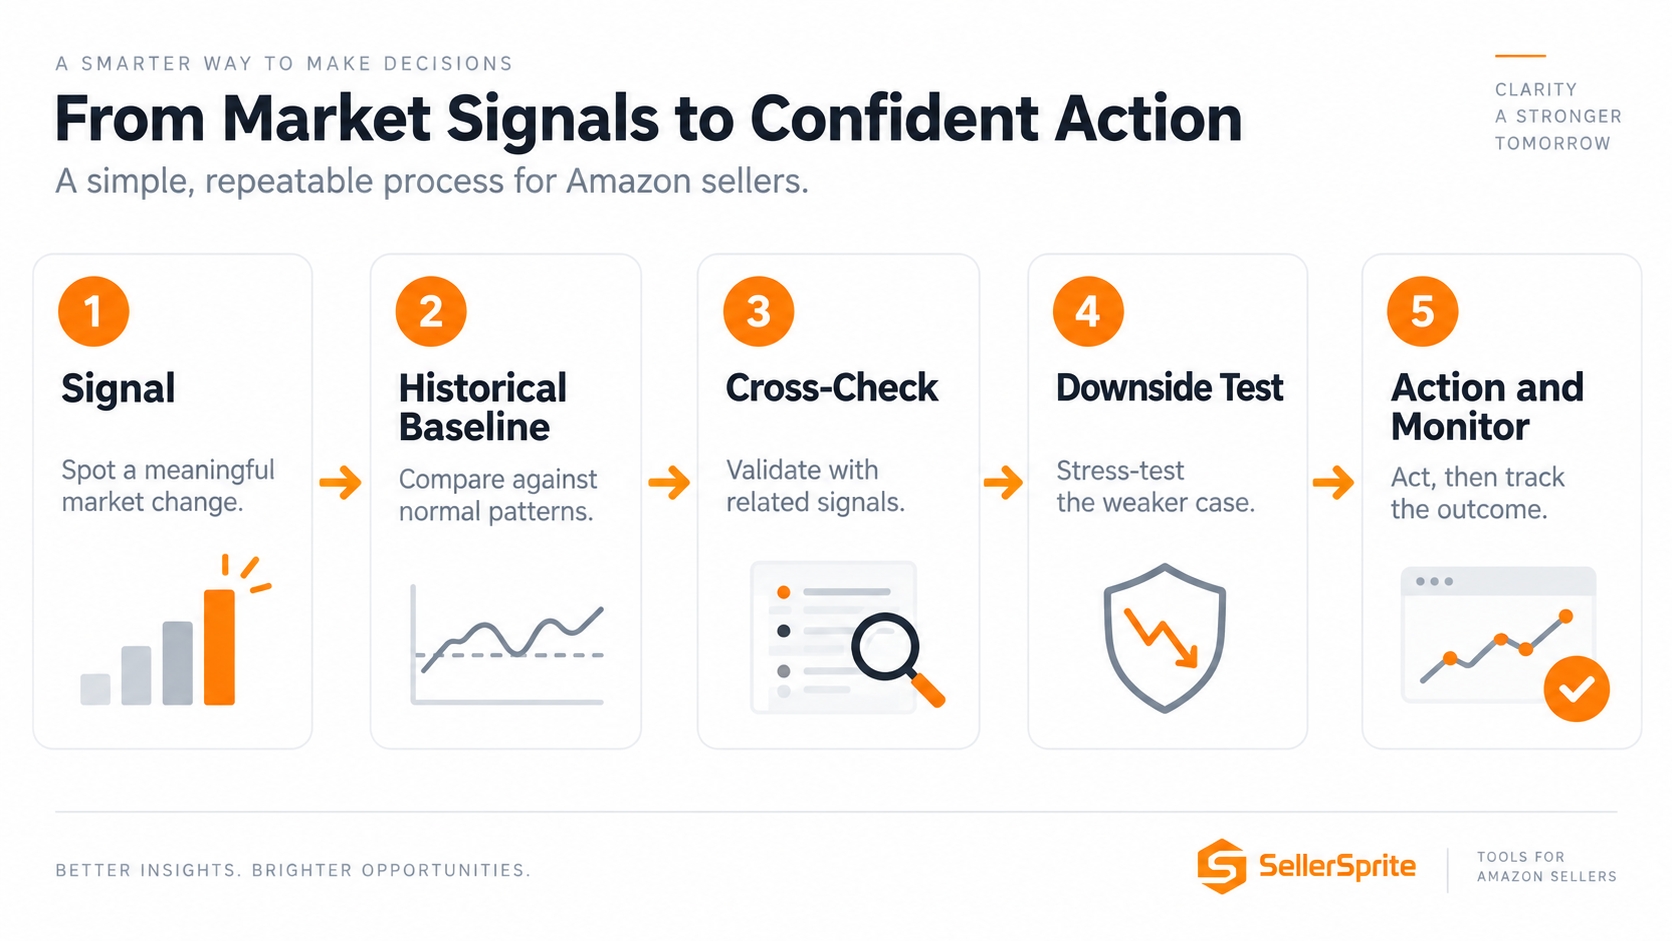
The purpose of Amazon Stock and Seller Insights is not to collect more data. It is to reduce uncertainty around a specific decision.
- Define the decision first.
Decide whether you are evaluating a new market, responding to a competitor, planning inventory, changing price, or diagnosing performance. - Establish a historical baseline.
Review normal price, BSR, estimated sales, keyword positions, reviews, and seasonality before interpreting a recent change. - Identify the trigger.
Find the first meaningful movement, such as a price cut, stockout, ranking gain, coupon, new competitor, or seasonal event. - Look for confirmation.
Check whether independent metrics support the same interpretation. - Model the downside.
Test what happens if demand is lower, advertising is more expensive, price falls, or inventory moves more slowly than expected. - Take the smallest useful action.
Test a measured adjustment rather than rebuilding the entire strategy around one market movement.
Which Metrics Matter for Which Seller Decision?
| Seller Decision | Start With | Confirm With | Main Risk |
|---|---|---|---|
| Enter a niche | Sales trend and demand | Competition, reviews, keywords, margin | Demand without sufficient margin |
| Change price | Price history | Sales, BSR, promotions, margin | Starting a price war |
| Replenish inventory | Sales velocity | Seasonality, lead time, stock level | Overstock or stockout |
| Increase ad spend | Keyword visibility | Conversion, organic rank, margin | Paying for unqualified traffic |
| Differentiate a product | Review themes | Search demand and competitor coverage | Building features customers do not value |
Example: What a Competitor Price Drop Really Tells You
Imagine a leading competitor reduces its price from $34.99 to $29.99.
A seller watching only price may immediately consider matching $29.99. A signal-based analysis investigates what happened around the price change first.
| Signal | What You Observe | Possible Interpretation |
|---|---|---|
| Price | $34.99 to $29.99 | Promotion, inventory pressure, or competitive response |
| BSR | Improves materially | Relative sales performance may be strengthening |
| Estimated sales | Increase | The lower price may be contributing to stronger demand |
| Keyword rank | Several terms improve | Greater search visibility may also be contributing |
| Inventory | Remains available | The seller may be pursuing volume rather than clearing the final units |
Even when the signals appear aligned, they do not automatically justify copying the competitor's price. You still need to determine whether your own product can operate profitably at $29.99.
Competitor behavior is evidence to investigate, not an instruction to imitate.
How SellerSprite Can Help Connect the Signals
The challenge is rarely finding one Amazon metric. The harder part is connecting product, keyword, competitor, and historical information without losing context.
Stage 1: Validate the Market
Use Product Research and Category Insights to understand demand, competition, price distribution, review thresholds, historical sales patterns, seasonality, and product concentration before committing to a niche.
Stage 2: Understand Competitor Search Visibility
Use Reverse ASIN, Keyword Research, and related keyword workflows to identify which terms competitors rank for, where visibility overlaps, and where relevant search demand may still be underserved.
Stage 3: Compare Historical Movement
Compare changes in price, estimated sales, BSR, reviews, and keyword position over time. Historical movement helps separate persistent market patterns from isolated fluctuations.
Stage 4: Monitor After You Act
Research does not end when a product launches or a pricing decision is made. Use SellerSprite Product & Keyword Tracker to monitor relevant product and keyword signals over time.
Common Mistakes When Reading Amazon Seller Signals
Market data becomes less useful when sellers react too quickly or interpret one metric without enough context. Many poor decisions come not from a lack of data, but from drawing conclusions before checking historical patterns, related signals, and business economics.
The following mistakes are common when analyzing Amazon seller signals and can lead to unnecessary price changes, inventory risk, or misleading conclusions about competitors and demand.
Reacting to One Day of Data
Daily changes can result from promotions, stock movement, advertising, ranking volatility, or temporary events. Look for persistence before turning a short-term fluctuation into a strategic conclusion.
Treating BSR as Exact Sales
BSR is a relative sales rank within a category. It should not be described as an exact sales count. Compare it with estimated sales and other marketplace signals.
Assuming a Stockout Always Means High Demand
High demand can cause a stockout, but supply delays, forecasting errors, fulfillment problems, and conservative purchasing can produce the same visible result.
Copying a Competitor's Price
Competitors can have different manufacturing costs, advertising efficiency, fulfillment arrangements, goals, and inventory positions. Their acceptable price is not automatically your acceptable price.
Ignoring Seasonality
Comparing a seasonal peak with a normal month can create misleading conclusions. Where possible, compare recent movement with the same period in earlier cycles as well as recent weeks.
Confusing Correlation With Cause
Sales rising after a price cut does not prove that the price cut caused the full increase. Keyword rank, advertising, seasonality, competitor stockouts, external traffic, and listing changes may also contribute.
A Simple Weekly Market Review
Sellers do not need to analyze every metric every day. A lightweight recurring review can make market intelligence easier to use.
Weekly Amazon Seller Signal Checklist
- Check whether major competitors changed price or coupons.
- Review meaningful BSR and estimated sales movement.
- Look for competitor stockouts or inventory recovery.
- Review important keyword gains and losses.
- Note rapid review growth or rating changes.
- Check whether new listings are gaining traction.
- Separate seasonal movement from structural market changes.
- Record only changes that could affect a real business decision.
The Bottom Line
Amazon Stock and Seller Insights becomes useful when price, inventory, BSR, estimated sales, keywords, reviews, and margin stop being treated as separate dashboards.
Price shows how products are positioned. Inventory provides supply context. BSR and estimated sales help indicate demand movement. Keywords reveal search visibility. Reviews reveal customer response. Margin determines whether the opportunity is economically viable.
The objective is not to predict every competitor move. It is to recognize when multiple signals are telling a similar story, validate that interpretation against historical evidence, and make a measured decision before committing more inventory, advertising budget, or pricing flexibility.
FAQ
What does Amazon Stock and Seller Insights mean for Amazon sellers?
It refers to using multiple marketplace signals, including inventory availability, historical price, estimated sales, BSR, keyword visibility, reviews, seasonality, and competitor activity, to understand how an Amazon market is changing and what seller decision may need attention.
Which metrics matter most for Amazon stock and seller insights?
Useful metrics include price history, estimated sales, BSR, inventory availability, keyword ranking, review growth, competitor activity, seasonality, and margin. The correct combination depends on whether you are evaluating a niche, planning inventory, adjusting price, or analyzing competitive performance.
Does a competitor stockout always indicate strong demand?
No. Strong demand can contribute to a stockout, but so can supply delays, forecasting errors, conservative purchasing, fulfillment problems, or temporary replenishment gaps. Check sales, BSR, price, and other competitive signals before drawing a conclusion.
How can SellerSprite help analyze Amazon stock and seller insights?
SellerSprite can help sellers connect product, keyword, competitor, and historical research. Product Research supports market validation, Reverse ASIN and Keyword Research help analyze search visibility, and Product and Keyword Tracker can be used to monitor relevant changes over time.
How often should sellers review these market signals?
There is no universal frequency. Stable evergreen products may only need periodic reviews, while product launches, seasonal categories, major promotions, sharp price changes, stockouts, or sudden ranking movements may justify more frequent monitoring.
Can Amazon seller data predict future sales?
Marketplace data can help sellers identify patterns and build better assumptions, but it cannot guarantee future sales. Demand, competition, Amazon fees, advertising performance, seasonality, supply conditions, and customer preferences can all change.
References
- SellerSprite Product & Keyword Tracker Guide View
- SellerSprite Keepa Alternatives: Track Amazon Price History View
- SellerSprite Product Research Quick Tips View
- SellerSprite Data Update Frequency View
- Amazon Guide to Amazon Sales Rank: Best Sellers Rank View
- Amazon Inventory Management Techniques and Best Practices View
By SellerSprite Content Team
The SellerSprite Content Team combines Amazon marketplace research with data-analysis workflows to help sellers evaluate product demand, competition, keyword visibility, inventory risk, pricing, and market opportunities using practical marketplace data.
Last updated: September 20, 2026